How to check turbo pressure without a pressure gauge on a TFSI, TSI or TDI engine? On a Golf 5, Scirocco, TT, Golf 7R, TTRS or RS3?
For those of you who don’t have a turbo pressure gauge on your car, here’s a short tutorial to help you see how your turbo is performing. Checking turbo pressure is important when you buy a car, as it allows you to find out whether the turbo is blowing correctly, and also to check whether or not the turbo is giving more than it should, and therefore whether the car has been reprogrammed. The question “How to log turbo pressure on the VCDS” can be found here.
-> VCDS : FAP regeneration
-> VCDS: Debrider maximum speed (V-max)
-> VCDS: Checking injector values
Contents:
I – Troubleshooting turbo problems
II – Procedure : LOG VCDS TURBO PRESSURE
III – Data analysis
IV – Drawing a graph from the file
V – Interpreting the graph
I – Troubleshooting turbo problems
If your engine lacks power, it may be due to boost pressure problems.
After reading the faults in “Engine – 01”, you will notice some faults, such as a turbo error:
Boost pressure too high:
In most cases, this is indicative of turbo seizure.
Boost pressure not reached:
In most cases, this indicates the loss of a leak in the vacuum circuit. The effective pressure does not reach the recommended values.
Fault code 000175 / P00AF – turbo actuator blocked
Causes: vacuum pipes pierced or porous Wategate pierced , Solenoid valve n75, variable geometry seized or blocked.
Error codes such as 17965 – Boost pressure regulation Control limit exceeded
P1557 – 35-10 – – Intermittent ”
Or 16618/P0234/000564 may indicate that boost pressure regulation has been exceeded.
This may be due to possible seizure of the turbo and its relief valve, the wastegate, the N75 valve, a damaged hose, the pressure sensor…
Boost pressure. It can be very useful to log this group in order to diagnose seizure of the turbo’s variable geometry.
II – Procedure : LOG VCDS TURBO PRESSURE
1 – Connect the PC to the car, switch on the ignition and start your VCDS.
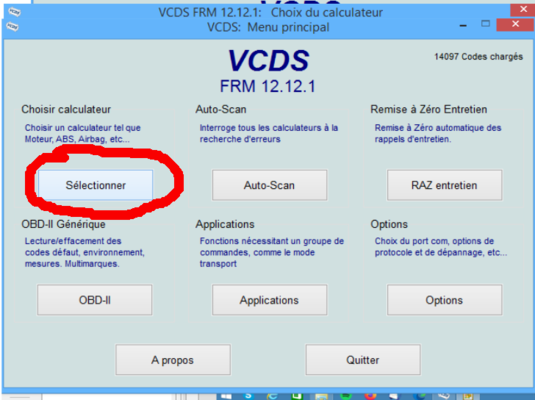
2 – Once the software has been launched, click on“Select”.
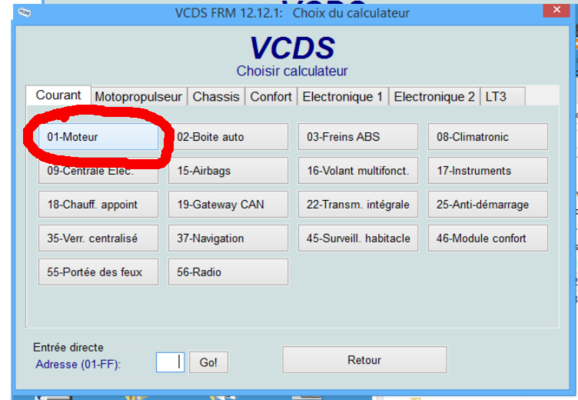
3 – Then click on “01-Motor”.
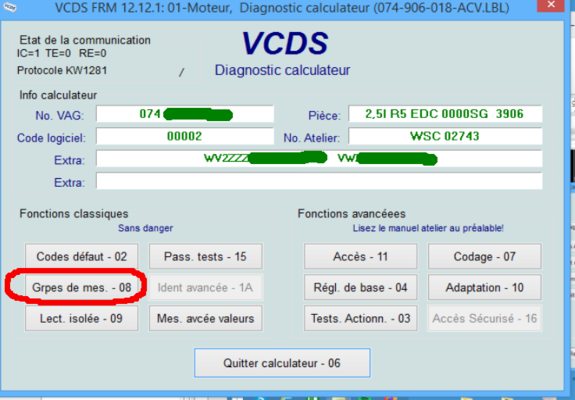
4 – Click on “Measurement groups – 08″.
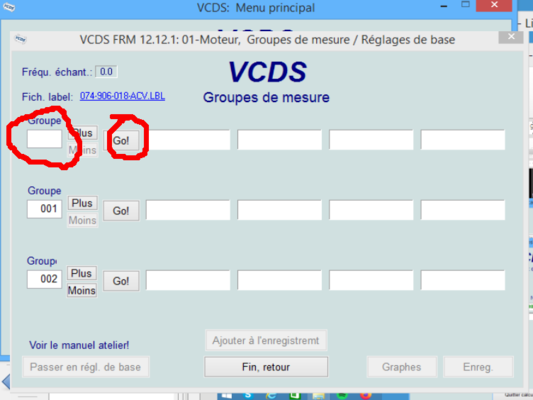
5 – To select the measurement group to be observed, enter its number and click on “Go!
6A – PETROL TSI TFSI
Go to Group 115 :
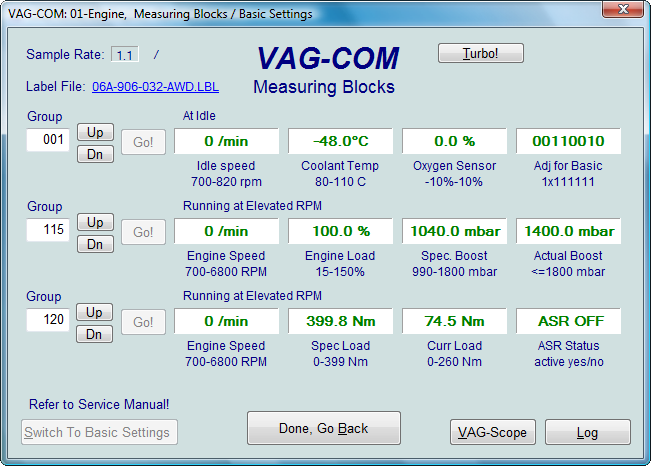
In this window, you’ll see the actual turbo pressure (the one you’d see on a mano) and the turbo pressure requested by the ECU, as well as the engine speed and load (i.e. whether you’re putting your foot down).
Information: You can, of course, enter other groups, such as 120, which is torque, but remember this. Older cars that don’t have the “Turbo!” button (see top right image) only take 4 measurements per second. If you set 2 groups, the values will be divided by 2, quite simply.
For those with the “Turbo!” button, pressing it boosts the number of measurements.
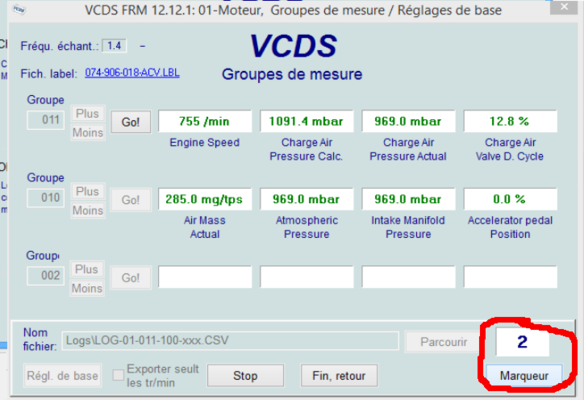
6B – Diesel TDI
The corresponding groups in this case are 10 and 11.
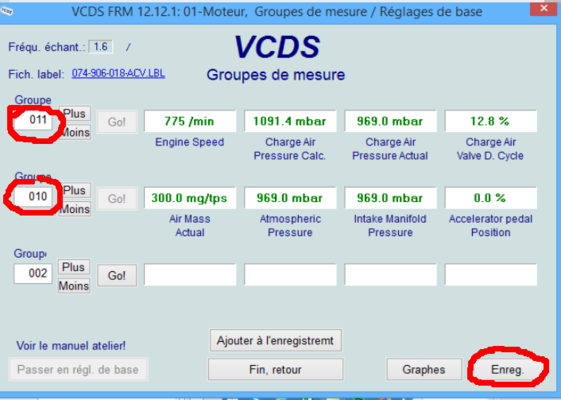
7 – Values:
Engine speed (in rpm).
Boost pressure requested by ECU (in mBar).
Actual turbo boost pressure (in mBar).
Boost pressure control valve activity (N75) (in %).
You can see the measurements live, but to understand them better, you need to have a record of them.
This can be done either :
- with a graph → “Graphs” button
- by saving data → “Save” button
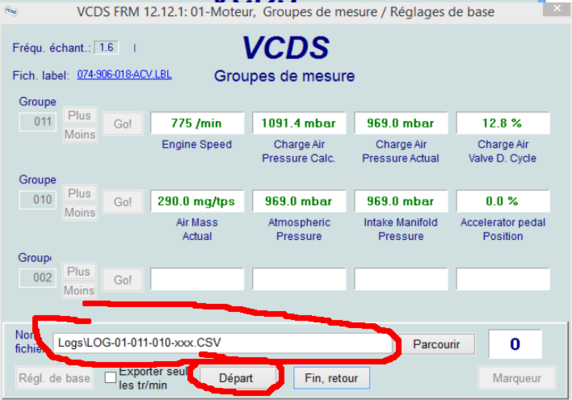
For “Save”. A window opens, a file name is given by default.
Start recording by clicking on “Start”.
8 – This is where the test drive begins, often on the road. Of course, you don’t look at the screen while driving. A co-driver can be very helpful, especially when it comes to clicking on the “marker” button, which will put a marker in the file at relevant moments…
Now it’s time to hit the road, and test in 4th gear if possible. Two people are highly recommended for this test, so that the driver is not distracted by the measurement shown on the display.
On a gearbox ratio equal to or higher than third gear, depress the gas pedal to maximum at 2000 rpm until you reach 3500 rpm.
9 – At the end of the test, click on “stop” and close VCDS.
Open the file you’ve just saved using Explorer and go to \VAGCom\Logs
Excel should launch (if you have it, of course) and show you the file
Graph the actual pressure and engine speed against time, for the period during which you carried out the test.
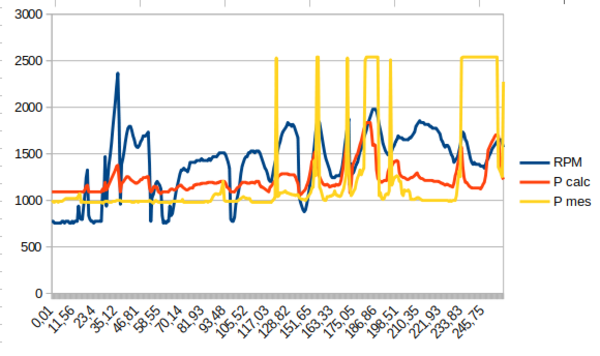
You obtain a graph of this type (Tuto to create a graph at the bottom of the page) :
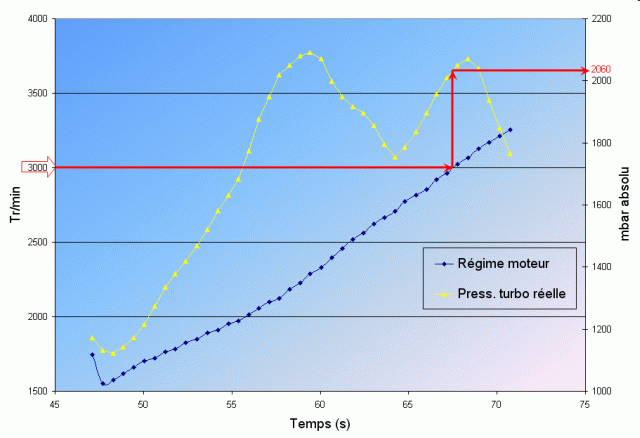
An overshoot is observed, which is then regulated to a set value.
For diesel engines 1.9 TDI, at 3000 rpm the value must be within the following range:
-90 bhp: 1850 to 2250 mbar
-100 bhp: 1850 to 2250 mbar
-105 bhp: 1850 to 2400 mbar
-110 bhp: 1850 to 2250 mbar
-115 bhp: 2000 to 2200 mbar
-130 bhp: 2100 to 2600 mbar
-136 bhp: 2100 to 2500 mbar
-150 bhp: 2200 to 2800 mbar
III – Data analysis
A simple live reading of the parameters may suffice to determine the source of the fault.
The following image shows a problem with the measured pressure: 2359mbar with the engine at idle. This indicates a problem with the pressure sensor.
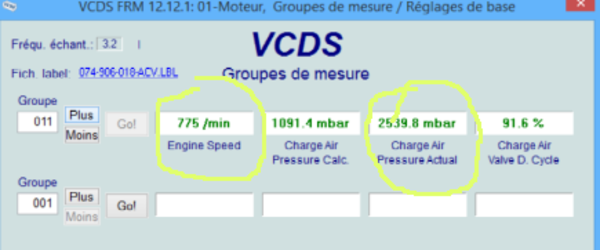
But of course, you may want to rethink data recording.
To do this, open the file created by VCDS. It’s usually in the C:/RossTech/logs directory.
As this is a CSV file, it’s easiest to open it with a spreadsheet program. In this case, LibreOffice.
The file must be “imported”.
Depending on the operating system, you may have to choose other options for the character set. The bottom of the import window allows you to check that the chosen options are correct.
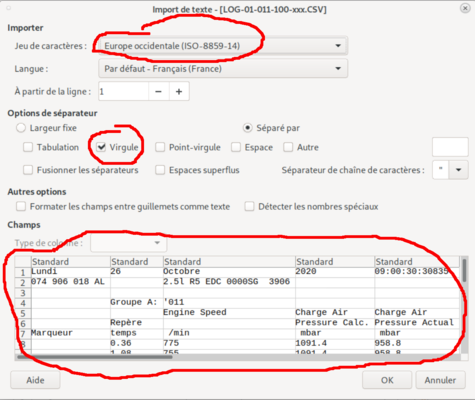
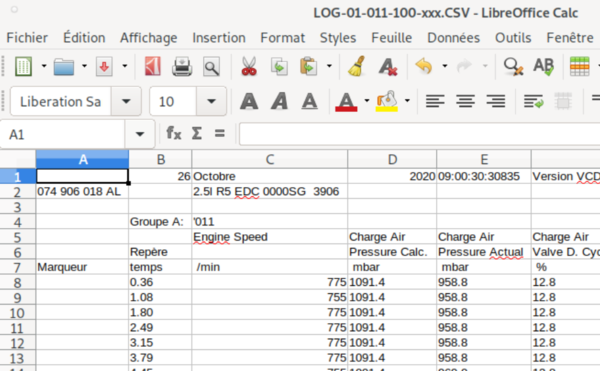
We end up with something that looks like this.
The data is in columns.
The “marker” column is empty, except at times when a marker has been inserted.
We can be content with this and read this table or want to make a graph out of it.
IV – Drawing a graph from the file
In the file generated by VCDS, the data is written with a dot as a decimal separator. Your spreadsheet may not be able to treat them directly as numbers.
To get around this, you need to make a copy of the data and transform the numbers written with dots into numbers written with commas:
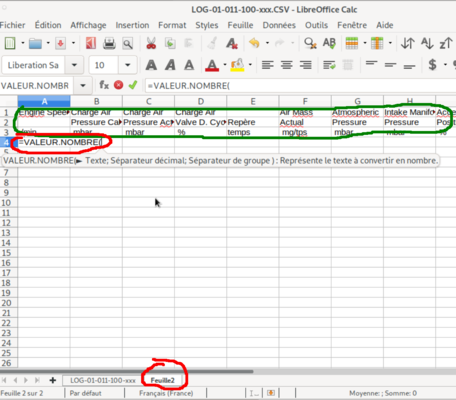
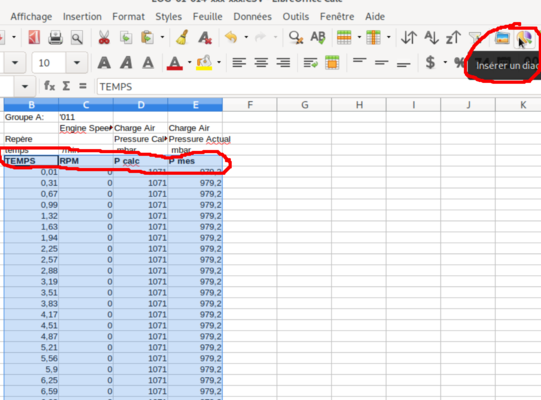
– create a second sheet in the table (here it’s called “Sheet 2”)
– copy the column headings (circled in green) onto it
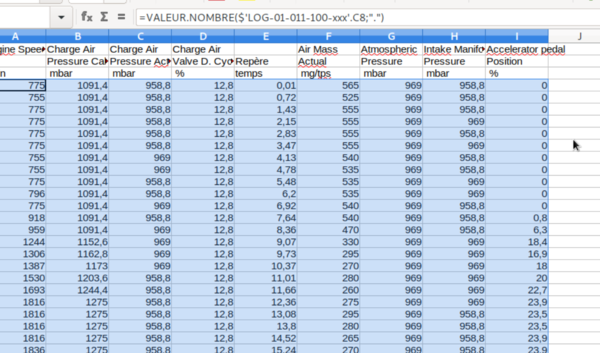
Then insert a formula at the location of the first value:
=VALUE.NUMBER(
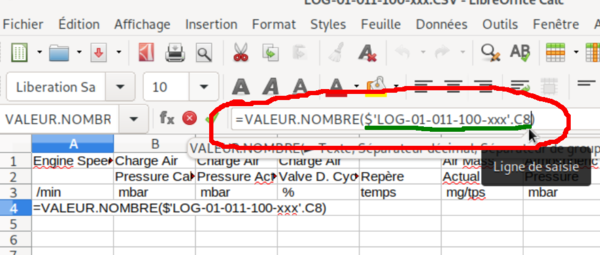
Then click on the first value in the original sheet and validate.
This will complete the formula with the address of this first value, in this case “$LOG-01-011-100-xxx.C8”.
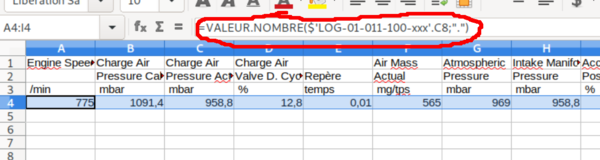
Finally, complete the formula with:
; ʺ. ʺ)
The formula will then look like:
=VALUE.NUMBER($LOG-01-011-100-xxx.C8 ;ʺ. ʺ)
Which means equal to the value contained in cell C8 of sheet LOG-01-011-100-xxx where the dot is the decimal separator.
Once this has been done, you can “drag” this cell across the entire line.
Then all the columns.
The values are now numbers.
Once this has been done, you can turn it into a graph.
The best idea is to insert a line (the one circled in red) and write a clear title for each column.
Once this has been done, select the data and this title line and click on the “insert diagram” button. The “insert / diagram” menu will have the same effect.
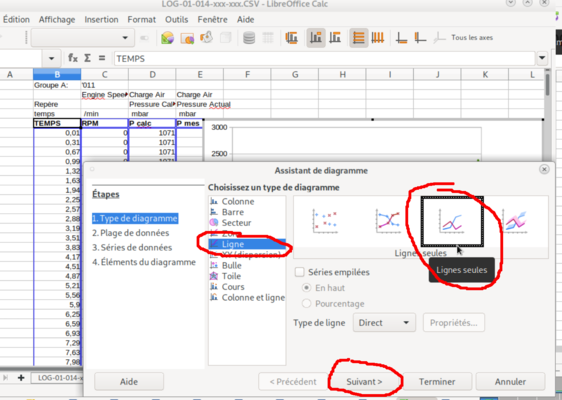
Select “line” in diagram types and “lines only” then “next”.
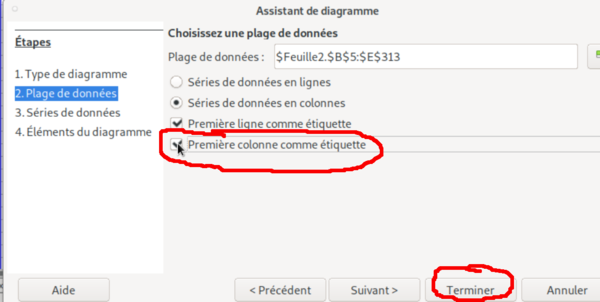
Check “first column as label”. At least in the example given, the first column corresponds to time.
Then “finish”.
V – Interpreting the graph
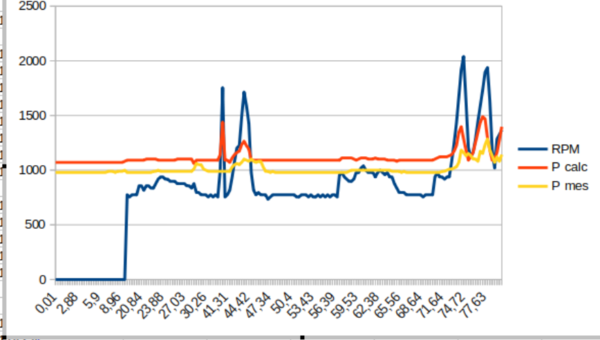
The graph is then displayed.
Here the behaviour is normal.
The pressure measured in the turbo increases with rpm and this measured pressure approximately follows the calculated pressure curve.
This other graph corresponds to measurements taken before diagnosis and repair.
We can see that the pressure measured is very (much too) high.
In this case, the problem was with the pressure sensor, or more precisely with its connectors: a false contact.